Articles
Here are some examples of how I have used Python and R to analyse business data. My focus centers around detecting patterns in data to reveal meaningful business insights - using a combination of data visualisation, machine learning, statistics, and time series techniques.
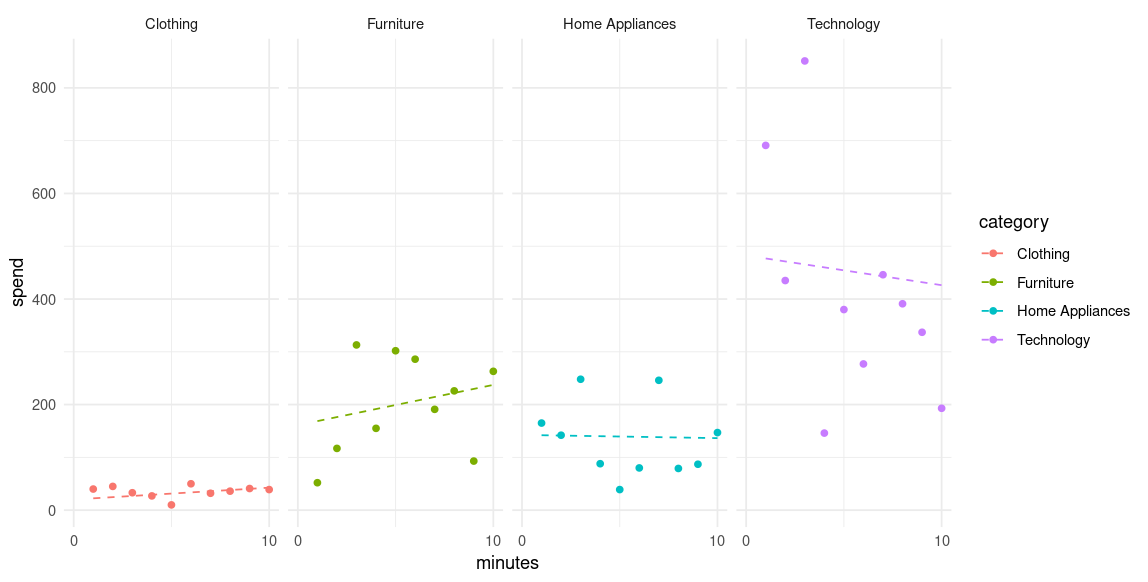
Multilevel modelling with lme4: Analysing e-commerce sales
Published Jul 12, 2024 by Michael Grogan
Multilevel modelling allows for analysis of data that have hierarchical or clustered structures. This is particularly useful in the context of market research, whereby segmenting customers by category (e.g. demographics, purchasing habits) is important in understanding how a business can both attract new customers and improve customer loyalty among existing ones.
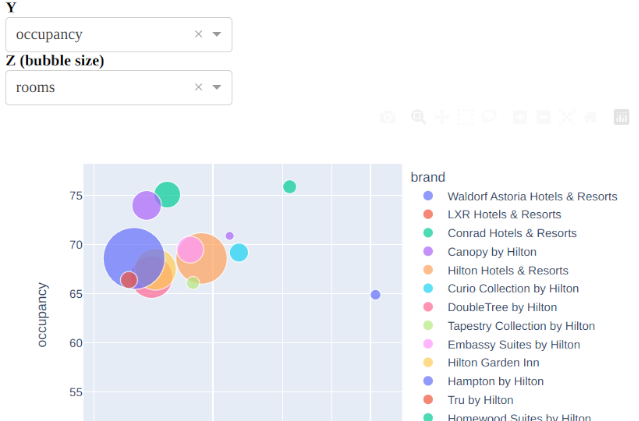
The use of updateSelectInput() with Shiny: Hotel Data Visualisation
Published Apr 21, 2024 by Michael Grogan
It is often the case that we would like for inputs within a Shiny Web App to change based on the value selected within another input. The updateSelectInput() function allows us to achieve this - here is an overview of how it works.
Visualizing Hotel Earnings Data using Dash and Shiny
Published Mar 9, 2024 by Michael Grogan
Being able to create effective dashboards for data visualization has become an increasingly important part of good data science - allowing a non-technical user to manipulate data in an intuitive way really allows us to yield full advantage of visualization techniques.
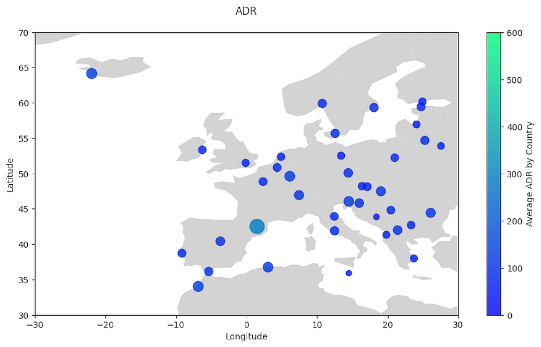
Geographical Revenue Analysis with GeoPandas and SQL: Analysing Hotel ADR
Published Jul 14, 2023 by Michael Grogan
GeoPandas is a Python library designed for working with geospatial data. It has many uses when analysing data across different countries. Specifically, companies that have international customers or operate internationally may be interested in metrics relevant to the regions in which they operate. Let’s see how this applies to hotel prices.
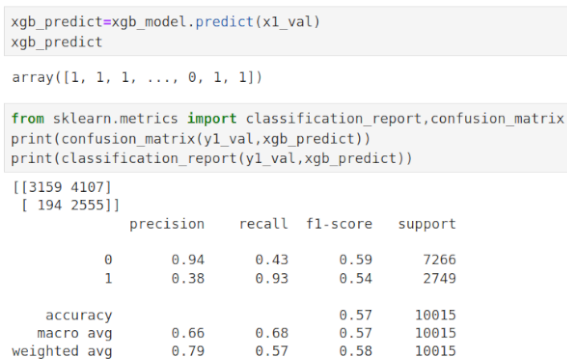
XGBoost and Imbalanced Classes: Predicting Hotel Cancellations
Published Jun 27, 2023 by Michael Grogan
Boosting is often referred to as an ensemble method. This is a technique whereby a series of individual models (or weak learners) are combined to build a model that yields superior predictive power (strong learner). XGBoost is quite a popular boosting method — it stands for “extreme gradient boosting” and is an extension to gradient boosted decision trees.
Handling Imbalanced Classification Data: Predicting Hotel Cancellations Using Support Vector Machines
Published Jun 27, 2023 by Michael Grogan
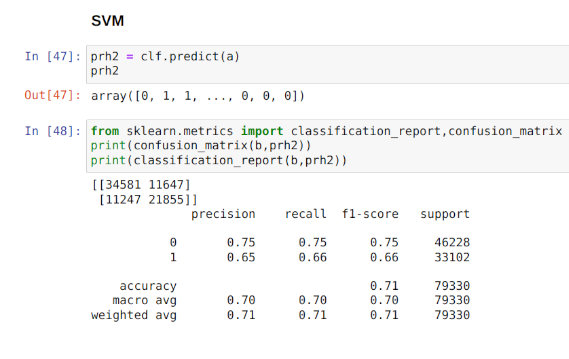
When attempting to build a classification algorithm, one must often contend with the issue of an unbalanced dataset. An unbalanced dataset is one where there is an unequal sample size between classes, which induces significant bias into the predictions of the classifier in question. This example illustrates the use of a Support Vector Machine to classify hotel booking customers in terms of cancellation risk.
SARIMA vs Prophet: Forecasting Seasonal Weather Data
Published Jun 26, 2023 by Michael Grogan
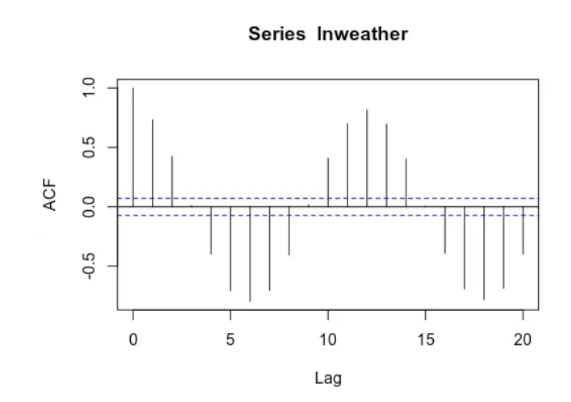
ARIMA and Prophet are major time series tools used to forecast future values. When conducting time series analysis, it is frequently the case that a time series will have a seasonal fluctuation — or a shift in the time series that periodically occurs during certain times. Weather data is a classic example of this — with temperatures fluctuating significantly during the four seasons.
XGBoost For Time Series Forecasting: Don’t Use It Blindly
Published Jun 25, 2023 by Michael Grogan
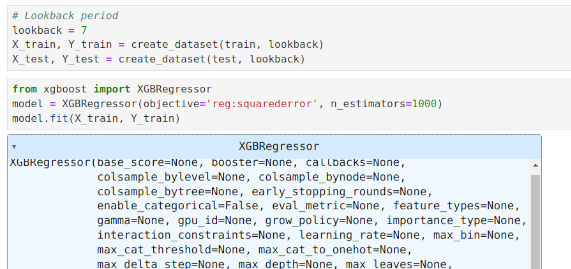
When it comes to using a machine learning model such as XGBoost to forecast a time series — all common sense seems to go out the window. Rather, we simply load the data into the model in a black-box like fashion and expect it to magically give us accurate output. A little known secret of time series analysis — not all time series can be forecast, no matter how good the model. Attempting to do so can often lead to spurious or misleading forecasts.
Forecasting Air Passenger Volatility Using GARCH Modelling
Published Jun 17, 2023 by Michael Grogan
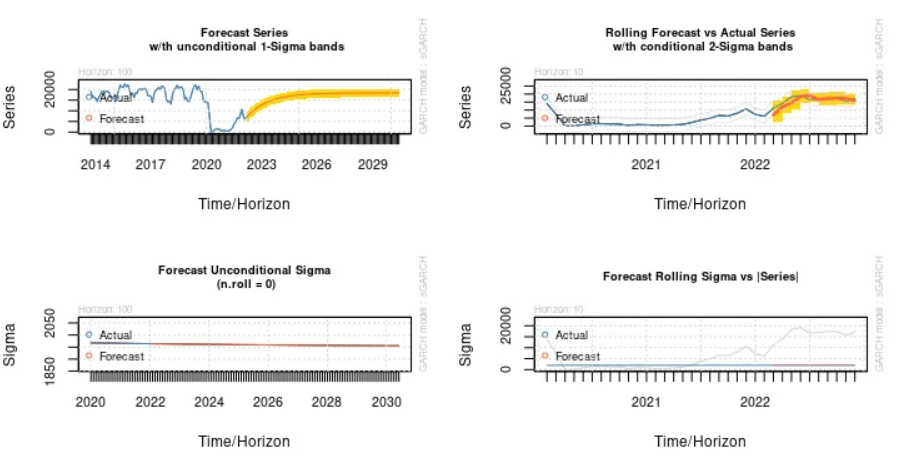
When attempting to forecast a time series, consideration is given as to both the trend and seasonality patterns in the series. That said, we can often come across a time series where the volatility in the series is not constant over time. This is known as autoregressive conditional heteroscedasticity. In this regard, a GARCH model can be used to forecast the volatility in a time series.
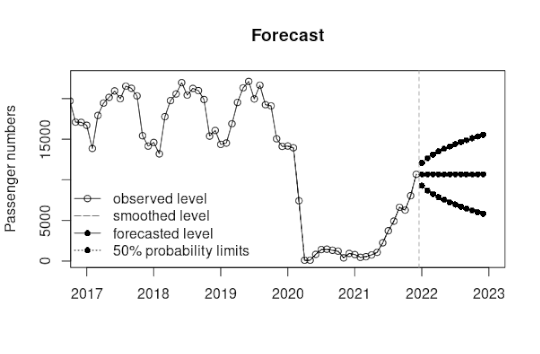
Structural Time Series Modelling: Forecasting Air Passenger Numbers
Published Jun 13, 2023 by Michael Grogan
Forecasting passenger numbers is an important task for an airline — as this will have implications for factors such as what type of aircraft should be deployed on a particular route, estimated fuel costs, expected revenue from a route, among others. Therefore, an airline that is looking to forecast passenger numbers needs to use a time series model that can quickly react to unanticipated “shocks”.
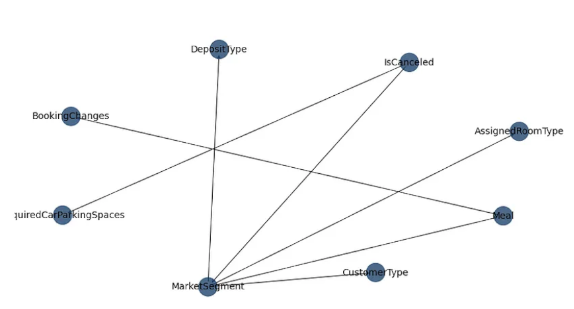
Bayesian Networks: Analysing Hotel Customer Data
Published Nov 25, 2021 by Michael Grogan
Bayesian networks are quite an intuitive tool when it comes to examining the dependencies between different variables. Specifically, a DAG (or directed acyclic graph) is what allows us to represent the conditional probabilities between a given set of variables. Using the bnlearn library in Python, let’s take a look at how such analysis can allow us to glean insights on dependencies between different attributes of hotel customers.
Forecasting Hotel Revenue: Predicting ADR Fluctuations with ARIMA
Published Jan 13, 2021 by Michael Grogan
Average daily rate represents the average rate per day paid by a staying customer at a hotel. This is an important metric for a hotel, as it represents the overall profitability of each customer. In this example, auto_arima is used in Python to forecast the average daily rate over time for a hotel chain.
ARIMA vs LSTM: Forecasting Electricity Consumption
Published Dec 12, 2020 by Michael Grogan
In this example, the ARIMA and LSTM models are used to predict electricity consumption patterns for the Dublin City Council Civic Offices, Ireland. Specifically, the data is provided in terms of kilowatt consumption every 15 minutes. Data is manipulated into a daily time series format using pandas and numpy, and forecasting performance across ARIMA and LSTM models are compared.
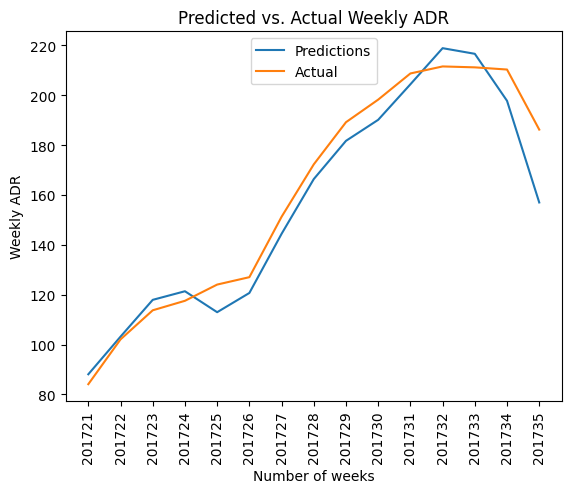
Regression-based neural networks: Predicting Average Daily Rates for Hotels
Published May 15, 2020 by Michael Grogan
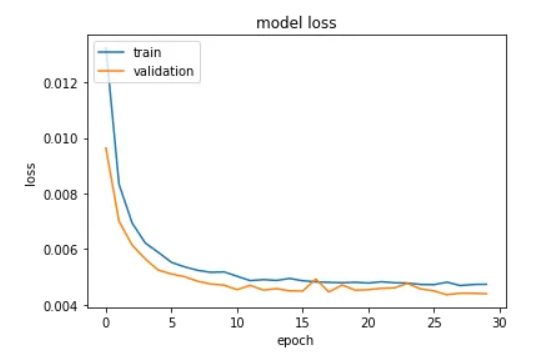
When it comes to hotel bookings, average daily rate (ADR) is a particularly important metric. This reflects the average rate per day that a particular customer pays throughout their stay. In this particular example, a neural network is built in Keras to solve a regression problem, i.e. one where our dependent variable (y) is in interval format and we are trying to predict the quantity of y with as much accuracy as possible.
