Geographical Revenue Analysis with GeoPandas and SQL: Analysing Hotel ADR
Published Jul 14, 2023 by Michael Grogan
GeoPandas is a Python library designed for working with geospatial data. It has many uses when analysing data across different countries.
Specifically, companies that have international customers or operate internationally may be interested in metrics relevant to the regions in which they operate.
Suppose a hotel chain in Portugal wishes to answer the following question:
“Of all the customers that book with our hotel, which countries show among the highest average daily rate for these customers?”
To answer this question, let us see how GeoPandas can be used to visualise countries with the highest average daily rates.
The dataset used for this analysis is the hotel booking dataset from ScienceDirect by Antonio, Almeida and Nunes (2019), which is licensed under the Creative Commons Attribution 4.0 International license.
Data Manipulation
Firstly, let us take steps to manipulate our data so as to work efficiently with GeoPandas.
The hotel booking dataset that we are given concerns a hotel chain in Portugal that contains booking data for customers across different countries, with an ADR value for each customer and whether or not they cancelled their booking (1 = cancelled, 0 = not cancelled).
We wish to accomplish the following:
Append the latitude and longitude of the capital city in each country to the country listed for each customer in the dataset (we will look only at the European market in this regard)
Obtain the average ADR value by country
Create a visualisation of average ADR by country in geopandas
Firstly, let us import the relevant libraries and then filter the dataset to only include entries where the IsCanceled variable is 0, i.e. only entries where the customer did not cancel their hotel booking.
import contextily as ctx
import geopandas as gpd
import matplotlib.pyplot as plt
import pandas as pd
from pandasql import sqldf
from sqlalchemy import create_engine

df=pd.read_csv("H1.csv")
df_filtered=df.loc[df['IsCanceled'] == 0]
The country variable in this dataset is in the ISO3 format, i.e. PRT stands for Portugal, DEU stands for Germany, and so on.
We would like to find the coordinates of the capital city for each of these countries. To accomplish this, we will use SQL to join the relevant information in the hotel dataset to the latitude and longitude.
To do this, it was decided to import latitude and longitude data from simplemaps, which licenses its Basic Database under the Creative Commons Attribution 4.0 license.
Specifically, the dataset in CSV format was imported into a PostgreSQL database, with pandasql then used to join the latitude and longitude data to the relevant hotel data.
The PostgreSQL database is imported into Python as follows:
engine = create_engine('postgresql+psycopg2://postgres:password@localhost/db')
table_name = 'coordinates'
coordinates = pd.read_sql_table(table_name, engine)
coordinates
In order to ensure that we are only joining country coordinates across the capital city and only including European countries, an INNER JOIN is created in sqldf to join the relevant country, ADR value, latitude and longitude coordinates where the country listed in ISO3 format in the hotel dataset matches that provided by simplemaps.
A WHERE clause is implemented to ensure that only the coordinates of the capital city are included along with latitude coordinates between 30 and 70, and longitude coordinates between -30 and 30.
maps_db = sqldf("select t1.Country, t1.ADR, t2.lat, t2.lng from df_filtered as t1 inner join coordinates as t2 on t1.Country=t2.iso3 where t2.capital='primary' and t2.lat>'30' and t2.lat<'70' and t2.lng>'-30' and t2.lng<'30';")Here is a sample of the data:
  Country ADR   lat     lng
0 GBR     -6.38 51.5072 -0.1275
1 GBR      0.00 51.5072 -0.1275
2 GBR      0.00 51.5072 -0.1275
3 GBR      0.00 51.5072 -0.1275
4 GBR      0.00 51.5072 -0.1275
... ... ... ... ...
26893 LUX  296.50 49.6117 6.1319
26894 LUX  308.57 49.6117 6.1319
26895 AND  236.00 42.5000 1.5000
26896 AND  354.00 42.5000 1.5000
26897 SMR  88.20  43.9346 12.4473
26898 rows × 4 columns
Now, we wish to take the above table and group average ADR values by country.
maps_filtered = sqldf("select Country, avg(ADR), lat, lng from maps_db group by Country order by avg(ADR) desc;")Here is a snippet of the data produced:
Country avg(ADR)   lat     lng
0 AND   295.000000 42.5000 1.5000
1 ISL   147.458333 64.1467 -21.9400
2 MAR   145.759231 34.0209 -6.8416
3 LUX   139.236852 49.6117 6.1319
4 SVN   137.395000 46.0514 14.5061
5 DZA   134.982857 36.7539 3.0589
6 ROU   121.564069 44.4325 26.1039
7 CHE   121.046192 46.9481 7.4475
8 HUN   120.393158 47.4925 19.0514
9 ESP   110.815135 40.4169 -3.7033
10 HRV  109.495556 45.8167 15.9833
...
Now that the table with the desired information has been produced, let us see how this can be plotted in GeoPandas.
Plotting with GeoPandas
The ADR plot in geopandas is created as follows:
# Creating axes and plotting world map
fig, ax = plt.subplots(figsize=(12, 6))
worldmap.plot(color="lightgrey", ax=ax)

# Plotting ADR data on world map
x = maps_filtered['lng']
y = maps_filtered['lat']
z = maps_filtered['avg(ADR)']
plt.scatter(x, y, s=z, c=z, vmin=0, vmax=600, alpha=0.8, cmap='winter')
plt.colorbar(label='Average ADR by Country')

# Creating axis limits and title
plt.xlim([-30, 30])
plt.ylim([30, 70])

plt.title("ADR\n")
plt.xlabel("Longitude")
plt.ylabel("Latitude")
plt.show()
Here is the generated plot:
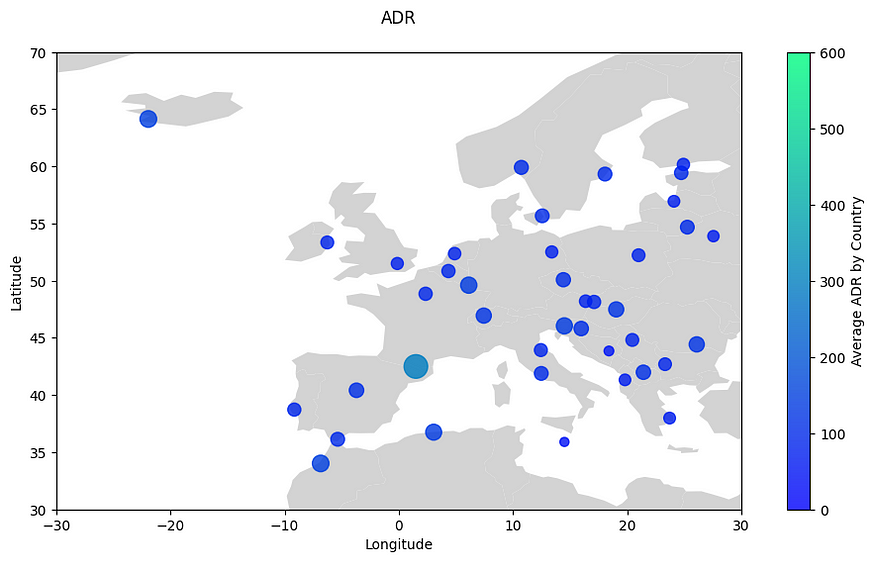
In this map, it is notable that Andorra shows the highest average ADR — as evidenced by the larger, green marking. Iceland and Morocco show the second and third-highest average ADR.
As we can see, a plot such as this allows for a quick overview of countries that show a higher average ADR. Moreover, given that customer bookings are constantly being updated — a hotel chain that is using this visualisation can continue to keep up to date with the latest ADR trends.
Conclusion
In this article, you have seen how to:
Manipulate data with pandasql
Use SQL to append latitude and longitude coordinates to a country in a dataset
Use GeoPandas to visualise average ADR by country